| Introduction | Exploratory Analysis | Forecasting Orders | Classifying Orders |
Forecasting
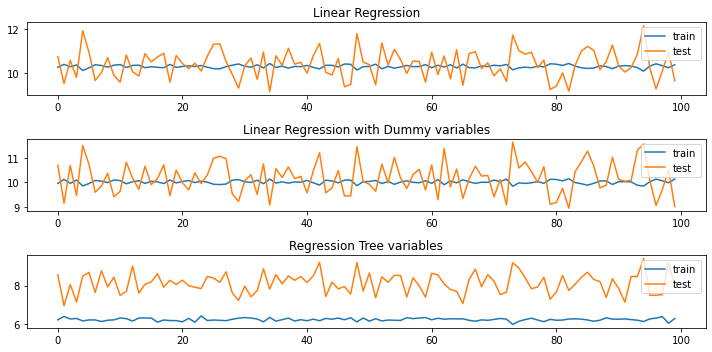
Being able to forecast the amount of orders has the potential to improve business efficiency, so the objective of this section was to forecast the amount of incoming orders. 4 different models were developed and tuned and their results compared
- A linear regression model
- A linear regression with dummy variables
- A regression tree model
- An ARIMA model
The main variable being predict(endog) is number of orders. This variable is created by aggregating the amount of orders obtained per day or per hour depending with the use case.
Cross validation setup for the linear regression model, model with dummy variables and the boosted tree is based on repeated cross validations (10 repeatitions of 10 splits). The ARIMA model is cross validated based on rolling cross validation, where the data is split into 10 testing folds.
A summary of the results between these models is summarised in the image below, indicating a comparison of the RMSE values between all models. Perfomance between a linear regression model with and without weekday dummy variables obtain almost similar results. The boosted tree model indicates improved performance compared to the linear model versions, notably though there is a significant disparity between RMSE values obtain between the train set and test set. Finally, the ARIMA model provides the best results. An accompanying results table shows the actual values
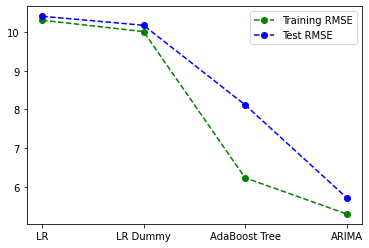
| Train RMSE | Test RMSE | |
|---|---|---|
| LR | 10.31 | 10.41 |
| LR Dummy | 10.02 | 10.18 |
| Boosted Tree | 6.23 | 8.12 |
| ARIMA | 5.29 | 5.72 |
Details of each model and the tuning process has been outlined in the subsections below.
Linear Regression model (OLS)
Following the data exploration section, a linear regression model is expected to provide weak results as the data involved showed very low correlations. Nonetheless using it as a part of the model set would provide a foundation for improvement.
Fitted model to be added here (mathjax)
Linear regression model with dummy variables
Since weekdays were shown to have different order patterns, this model explores if this patterns would result in a reasonable prediction model.
Regression Tree Model (Boosted Regression Tree)
trees are considered a good non-parametetric approach to this problem since the data indicated lack of non-linear dependicies between features.
To identify a good estimator tree, grid search cross-validation and randomised search cross-validation were applied. grid search results: {‘criterion’: ‘mse’, ‘max_depth’: 5, ‘max_features’: ‘sqrt’} randomized search results: {‘max_features’: ‘sqrt’, ‘max_depth’: 5, ‘criterion’: ‘friedman_mse’}
A boosted tree with max_depth=5, criterion=’friedman_mse’, max_features=’sqrt’ was eventually fitted. Perhaps I should have also compared results of the boosted tree from each of these methods independently.
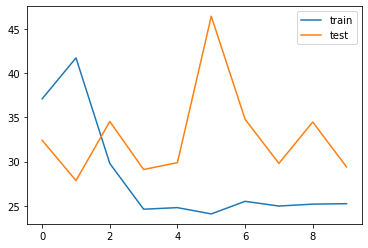
An ARIMA Model
Given that the data indicated highly cyclic characteristics, it is imperative that we test a dedicated timeseries model on the data. The image below indicates cross validation performance between test and train set.